
Data & Analytics

Dataverse Project Reporting Dashboard

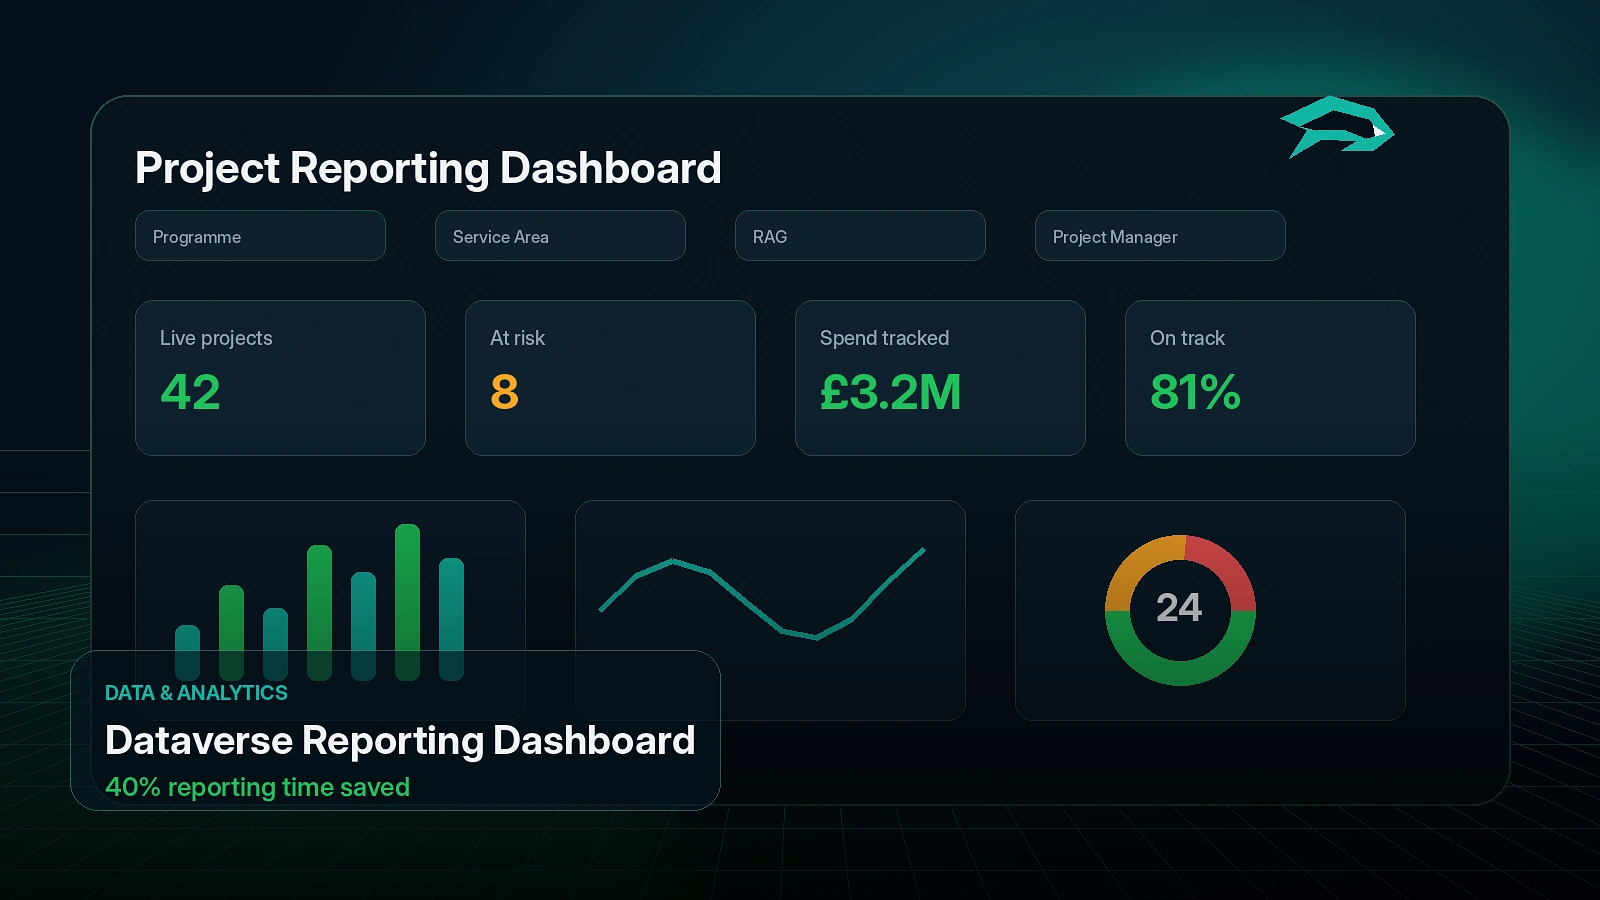
Dataverse project reporting with RAG status, risks, spend and performance tracking.

Dataverse Project Reporting Dashboard visual

Overview

A dashboard experience surfacing programme status, RAG indicators, risks, dependencies, spend and delivery confidence.

This delivery combines discovery, solution design, cloud tooling, secure implementation and measurable operational outcomes.
Challenge

What needed to change

Project reporting depended on inconsistent updates, manual collation and limited visibility across risks, spend, progress and delivery confidence.

Approach

How the work was shaped

We structured the reporting data model around the decisions leaders needed to make, then designed dashboard views for PMO and executive audiences.

Solution

What was delivered

The dashboard surfaced RAG status, milestones, risks, dependencies, spend and narrative updates from a Dataverse-backed reporting model.

Outcome

Why it mattered

Reporting became easier to standardise, compare and act on, reducing reliance on manual slide and spreadsheet preparation.

Technology used

DataversePower BIModel-driven appsPower Automate

Could this work for your team?

These patterns can be adapted for teams that need clearer records, better workflow control, more reliable reporting or stronger cloud delivery governance.

Want a similar outcome?

Book a discovery call and let's define the right approach for your organisation.